The 2008 Financial Crisis, Exploratory Analysis |
|
The financial crisis beginning in late 2008 saw the sharpest declines beginning in early October. While the GCP formal analysis protocols don't lend themselves to long drawn out events, we can do probes and can look at trends in an exploratory manner. We also defined one formal event to probe the meltdown period, looking at the bailout vote on Sept 29. William Treurniet produced some long-term graphical analyses which he describes in an email:
The following figure, suggested by William's analysis, shows October 6-10, the first week of the crisis. The trend is obvious, and compounds to a probability on the order of 0.016 that it is just chance fluctuation. The trends are relatively flat both before and after this week.
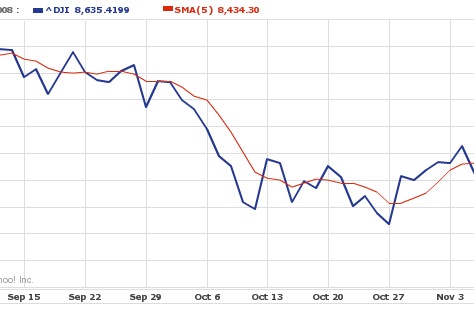
This figure is more impressive when we note that the strong deviation is a mirror reflection of the decline in the Dow Jones Industrial Average during that same week. The following figure shows mid September to early November. The deepening public awareness of the financial meltdown was driven by the precipitous drop in the DJI in the week of October 6 to 10. (Arguably, the meltdown was reciprocally driven by market perceptions.) The following figure shows the daily closings and a 5-day smoothed version (red) in which that week's decline is even more clear. The segment corresponding to the previous figure is just the central marked section starting with Oct 6.
Half Past Human ForecastThe Half Past Human group uses complex programs to analyse material extracted from the Internet. I had previously had other suggestions to look at predictions made by this group. In particular, Greg Nelson alerted me to a prediction they made in September, according to George URE, specifying a date and time when a major event would occur that would have effects and implications lasting as long as the 9/11 terror attacks. The date given was October 7, and the specific time was 07:10 UTC. Here is what Clif, the creator of Half Past Human says in an interview:
This remarkably specific moment is shown in the following graph as the beginning of a 10-hour period that does show a significant trend. (It may look familiar at first glance -- the graph is almost fractally similar to that for 120 hours shown above.)
Please remember that these analyses are post hoc, not formal, so interpretation in an evidentiary mode is not appropriate. It is also important to keep in mind that we have only a tiny statistical effect, so that it is always hard to distinguish signal from noise. This means that every "success" might be largely driven by chance, and every "null" might include a real signal overwhelmed by noise. In the long run, a real effect can be identified only by patiently accumulating replications of similar analyses.
|