|
This page shows exploratory graphics and variations, working toward a standard
set of analyses for the formal predictions made for global events. The intent
is to develop readable displays which allow the viewer to see the results
in context. Other analyses and graphics may also be used, but these provide instructive
views of the effects associated with the event.
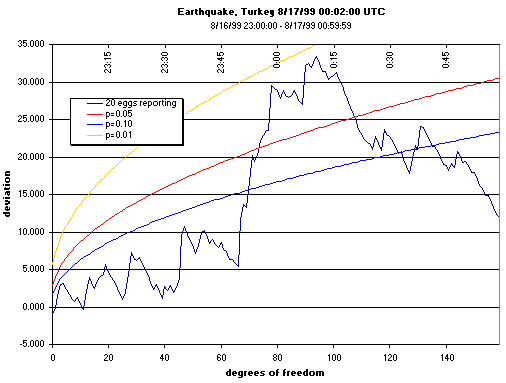
The primary display is typically a cumulative deviation graph showing the data within the period
identified in the formal prediction, using the blocking unit specified in the prediction.
This figure shows the accumulating difference between the Chisquare value and its
expectation, against a background showing the confidence or probability envelope.
This one shows the half-hour period defined as one of the predictions for the earthquake
in Turkey, on the 17th of August, 1999, surrounded by 45 minutes before and after.
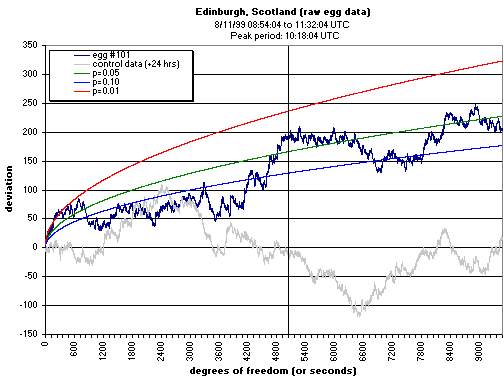
A more detailed view, looking at the raw second-by-second data may also be instructive.
In this case the data are from a single site during the solar eclipse, 11 August, 1999.
The trends in the cumulative deviation are very much dependent on the choice of blocksize,
and, while this example looks impressive, the formally specified two-minute blocks
combined across all Eggs did not show a strong accumulated effect.
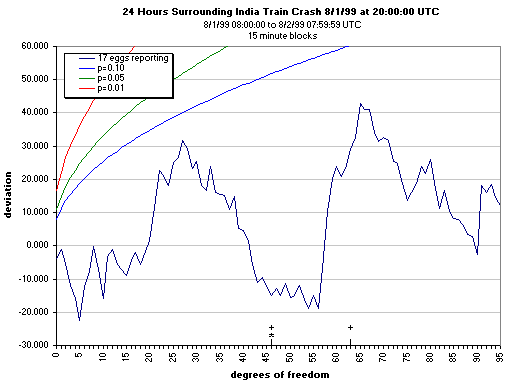
A useful context is provided by displaying data over a longer period, typically 24 hours,
surrounding the event, which in this example is the train crash in India on the 1st of
August, 1999. A strong positive slope represents an effect according to the prediction
for those parts of the trace corresponding to the event itself, a period of four hours
beginning, as marked, at the midpoint of this trace.
Details of the individual Eggs' performance can be displayed in various ways. One is to
use a color-coded matrix showing the Chisquares (Z^2) for the Eggs over a period of time, in
this case, 24 hours surrounding the time of the Turkish quake.

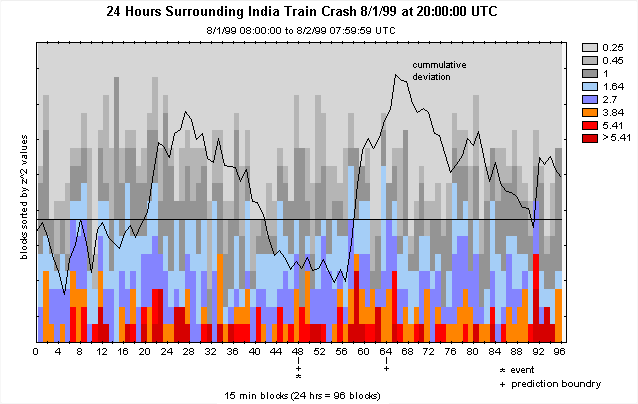
Returning to the India train crash example, this figure shows the
accumulating effect across eggs in a variation which sorts the Chisquares by
magnitude to identify those time-periods with relatively strong deviations.
In this example, the cumulative deviation trace is also superimposed.
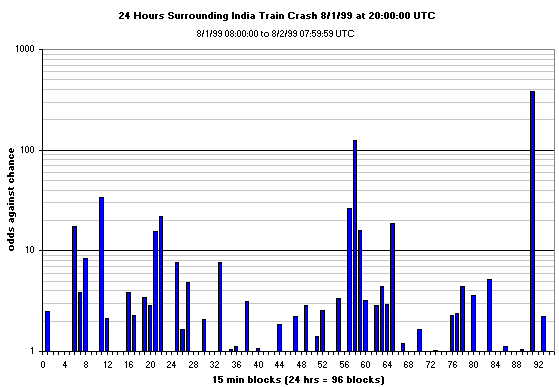
A more direct assessment of the likelihood of deviations as large as those of the event in
question, the India train crash, is given by plotting the odds ratio or
inverse probability, (1-p)/p, which emphasizes the larger deviations from expectation.
|