|
Zapata-Arauco, Spike analysis
Juan Zapata-Arauco applied a technique similar to Radin's variance assessment
to the geomagnetic data from May 11, 1999. His explanation follows:
Date: Mon, 17 Jan 2000 17:02:45 -0800 (PST)
From: juan zapata-arauco
Subject: GIF Analyses for selected Events/min at 5/11/99
To: rdnelson@Princeton.EDU

Dear Roger:

Congratulations for the impressive preliminary Y2K results. I believe that Dean
made a sophisticated and successful attempt for sorting the noise during
the transition to the new millennium (you may check that the geomagnetic activity
was very intense during this time).

I followed the steps of Dean (not in detail) for a superposed epoch analysis
around the minute of culmination of the Galactic Center(GC)in UTC for EGGs
under this condition during the extreme geomagnetic calm period of May 5,1999.
I assumed (1) that the extraordinary low in geomagnetic fluctuations during
this day could increase any hypothetical "anomalous" sideral signal affecting
the REGs working during the times of culmination of the GC, (2)that any
global/local consciousness effects during the intervals around GC
culmination (+/-30 min) in this day were negligible, (3) that in tone with
experimentally observed reduction of Anomalous Cognition Effect Sizes
under GC culmination this would be reflected in physical systems as a reduction
in noise or entropy, and (4) reduced entropy can be detected as a reduction
in the average of randon events recorded each minute around the minute of GC
culmination.

To search for these reductions, I made the following preliminary steps:

a)Download all per-minute raw data for EGGs 100,102, 103,107 and 1005
around +/-30 minutes of the times (minutes) of GC culmination.

b)Calculate the standard deviation across EGGs (SDAE) for each of these raw
values, per minute.

c)Create 5 one-hour blocks of raw values per minute, each centered on the
minute of GC culmination in each EGG's geographical longitude.

d)Create a superposed epoch analysis by overlaying the 5 blocks of data.

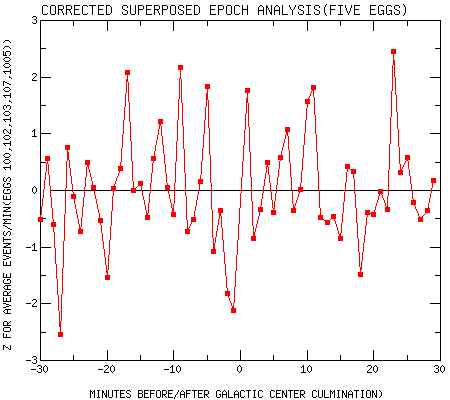
e)Calculate the total standard deviation across the 60 minutes of blocked
averaged data across the EGGs, design these values TSD.

f)Calculate the Variability Range of each average minute across EGGs in the
superposed epoch analysis dividing each SDAE by the total TSD. These values are
plotted in the figure "Range of Variability of the Superposed Epoch Analysis
(5/11/99)"

g)Make standard normal deviates (z scores) based on the total average per
minute and the observed averaged across EGGs per minute. These values are
plotted in the figure "Superposed Epoch Analysis(5/11/99)". From the resulting
z-scores, the odds against chance (one tailed) are not significant and are NOT showed.

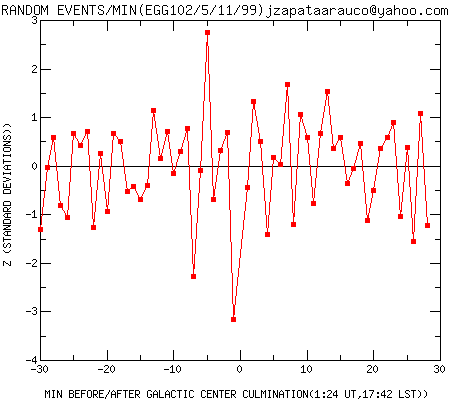
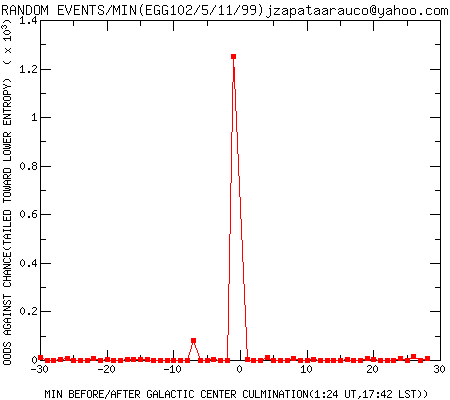
NOTE: It is interesting to note that for May 11, 1999 the z scores for one minute
before GC culmination are significant for EGG 102(Z=-3.15, p(one tailed)<0.0008)
and are showed in the two figures named "Random Events /min(EGG102/5/99)"
(z plot and odds against chance respectively). Similarly for EGG 100 we have for one
minute before GC culmination: Z=-2.09, p(one tailed) <0.0183 and for EGG 1005
(one minute before GC culmination): Z=-1.75, p(one tailed)< 0.0401. There is
another significant z-score in the direction expected and in another minute in
the 60 minute interval used in each case and for this reason the correspondent
figures are not showed.

Please let me know of any questions about these analyses.

With my best regards,

Juan
In a second note, Juan made some corrections:
Date: Tue, 18 Jan 2000 11:08:15 -0800 (PST)
From: juan zapata-arauco
Subject: Re: Correcting  theoretical assumption for Analyses for 5/11/99 data.
To: rdnelson

I believe that assumptions (3) and (4) that I used for this analyses are not
logically congruent as a reduction in noise or entropy can not be translated
to a reduction in the number of random events that is in itself another way
of increase noise or entropy.

Both assumptions corrected in this way must be read instead as one plain assumption;

"(3) that in tone with experimentally observed reduction of Anomalous Cognition
Effect Sizes under GC culmination this would be reflected in REGs as a reduction
in the average of random events recorded each minute around the minute of this
culmination."

With my best regards,

Juan
|
|
First the composite deviation of the 5 running eggs on May 11th, then the
deviation of egg102 alone, followed by an odds ratio figure, indicating that
egg 102 had a highly significant minimum of variance exactly at the
predicted time.


|