|
From the prediction registry:
Note: the correct time for the crash was 14:44 GMT, so
the figures here are incorrect -- the formal graph should be
shifted about 15 mins earlier.
Prediction, Reinhilde Nelson: July 25th, 2000 at 15:02 GMT. The Concorde
crash upon takeoff
from Paris will engage more attention than usual because the
Concord is a high-profile plane,
beautiful and symbolic of the romance of flying. It is the first
crash of a Concorde, which has been
considered one of the safest planes in the world since its
introduction in 1969. This was a chartered
flight with mostly German
tourists on their way to a cruise. All 100 passengers and 9 crew
were killed, as were four people
on the ground.
The primary analysis will be of the half hour surrounding the
crash and a four hour aftermath, with
the formal hypothesis test based on the half hour period, assessed at
one-second resolution, expectation high. The 4 hour
period is an exploration addressing the question whether
developing awareness of the news may reflected in the data.
Secondary analysis will
determine whether European eggs show greater reaction.
Analytical results:
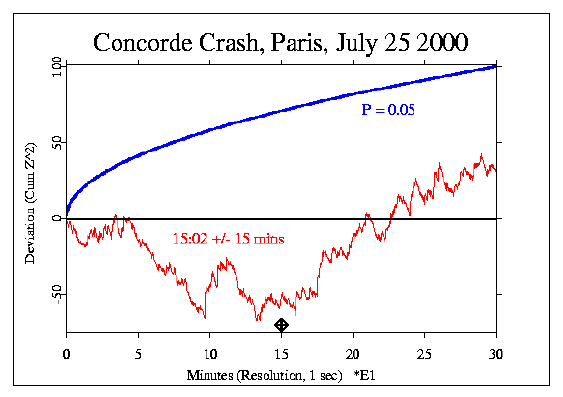
The outcome of the analysis is a positive deviation, with
chisquare 1830.2, on 1800 df, for a p-value of 0.304. The first
figure shows the half hour surrounding the crash, beginning at 14:47, UTC.

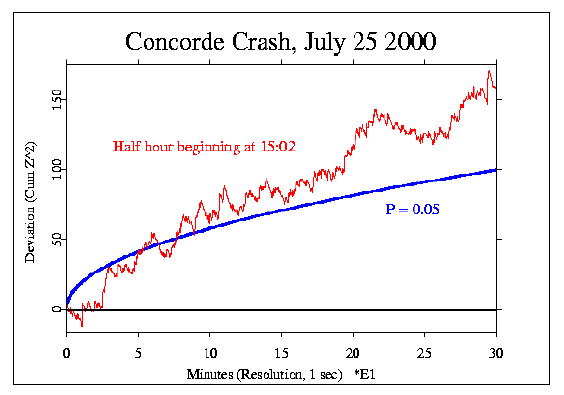
Arguably, the prediction might have specified the half hour following
the crash. If so, the result would have been highly significant,
with chisquare 1959.6 on 1800 df, for a p-value of 0.0047. The next
figure shows The half hour beginning at 15:02, UTC. It is followed by a
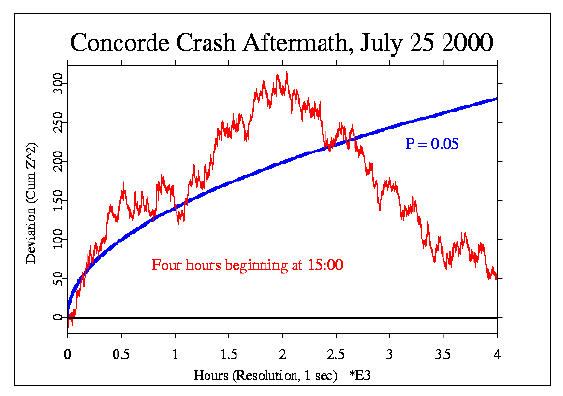
figure that shows the next four hours of what we may regard
as the aftermath, when people are hearing the news of the crash.


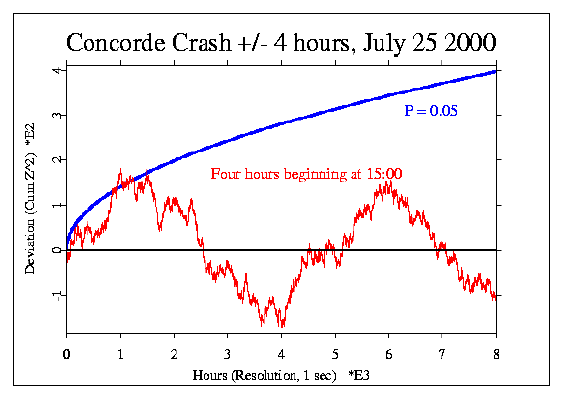
Reinhilde, who made the prediction, also suggested that a fair presentation
would show the data for a few hours prior to the crash, expecting it to
look essentially random (flat trend). But the figure shows periods
with rather
strong trends, some of which are nearly as impressive as the
segment immediately after the crash, begining at hour 4 in this graph.
This indicates, as does the comparison of the first two figures above,
and as we have seen in previous explorations,
the important role played by the specific formulation of
a prediction. A slightly different point of incursion or a
different length of time might yield a very different outcome.

|