Blocking the Data, Testing the Recipes |
|
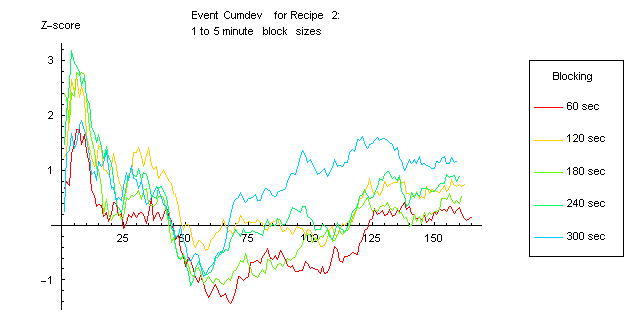
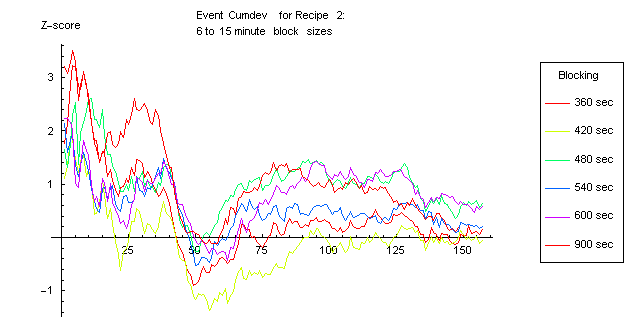
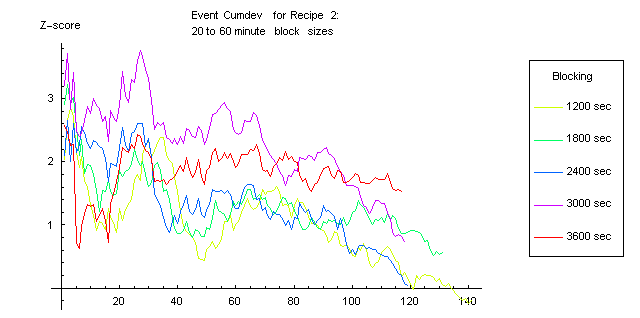
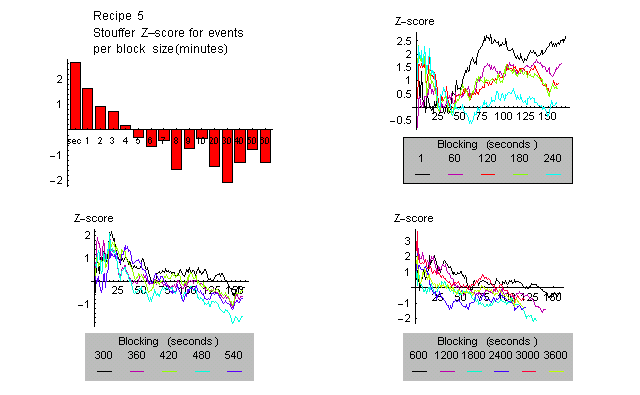
We can test the effect of different levels of blocking the data, using various recipes. Here we show recipe 2, which was used at first in hand calculations made from the 15-minute blocking automatically done in the "Eggsummary" tables. This takes the composite Z-score for each egg across the block, squares that and sums the Z² values across the eggs. The result is a Chisquare with degrees of freedom equal to the number of blocks times eggs. In the figures below, this calculation is done with a range of block sizes from 1 minute to one hour. The endpoint of each plot is the final cumulative zscore. Each point is the sum of event zscores divided by Sqrt(n). The resulting traces show a general decline, with much variation, for most block sizes across the years of accumulating events. This decline appears less important in long block sizes. Very short blocks show little indication of non-random deviation except perhaps in the first 10 or 15 events. The model block-size, 15 minutes, shows large deviations mainly in the events where it was the pre-defined analysis unit. [More comments to come.]
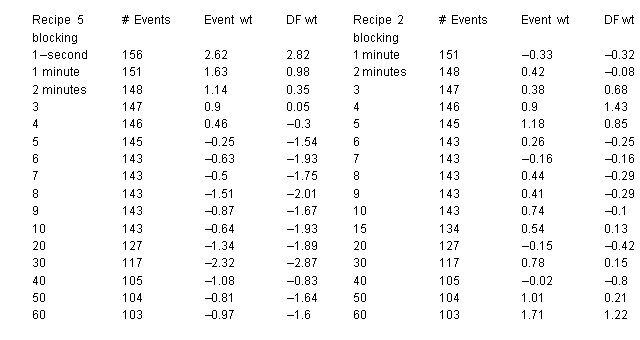
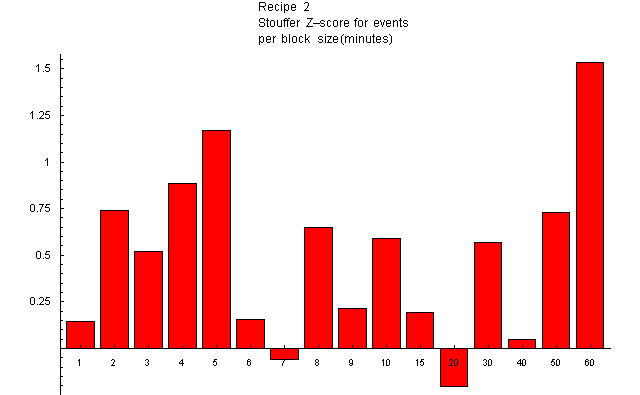
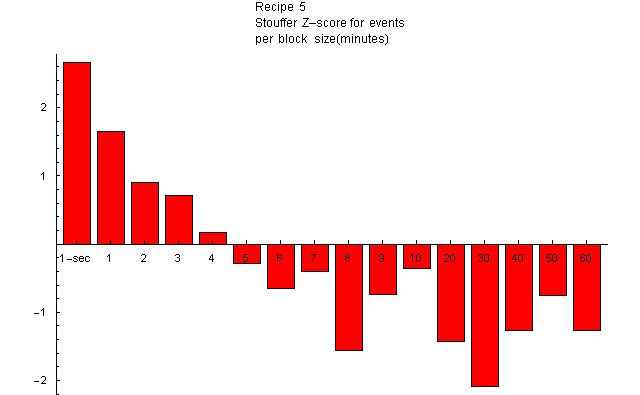
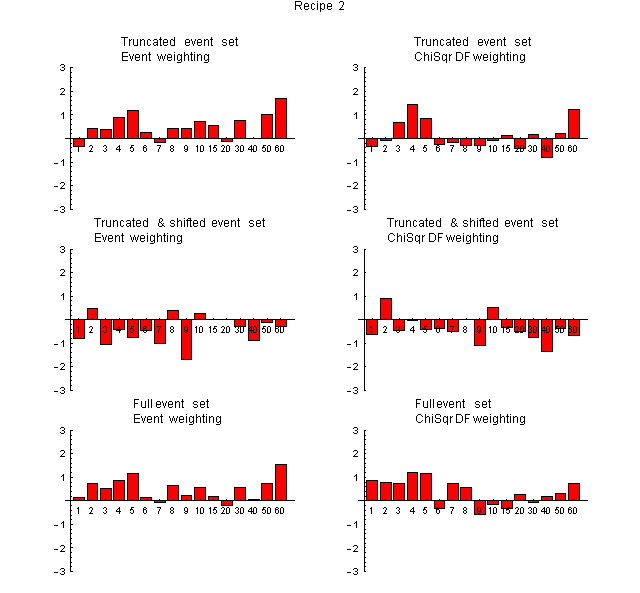
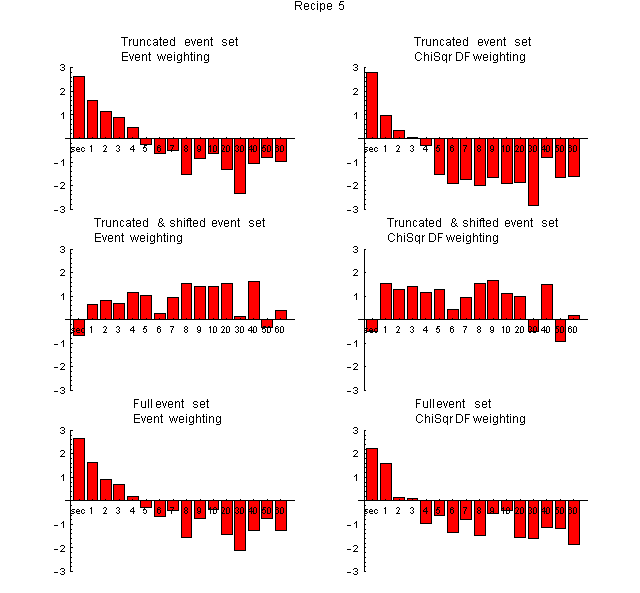
Bar ChartsA broader perspective can be gotten from visualizing the material in bar charts. Recipes 2 and 5 are the ones used for most events. They are, respectively, the 15-minute blocking used in early analysis, and the "standard analysis", a composite Stouffer Z across eggs, squared and summed across blocks (block size is almost always one second in the original analysis). The following table summarizes the exploration of block sizes for these two methods, with the number of events amenable to the blocking, and a composite (Stouffer) Z-score for two different weightings, equal for all events, and proportionate to the degrees of freedom.
|
